
Scroll
See It In Action
Ask a research question.
Get a rigorous answer.
You describe what you want to know. Inquiro picks the right method, checks the assumptions, and writes reproducible code.
Reproducible analysis
~/notebooks/school_feeding_evaluation.py
School Feeding Program Impact
Did free school meals improve test scores? 200 schools, 2015-2021
Why This Method Works Here
- Treated and control schools were trending similarly before 2018
- Schools didn't change behavior in anticipation of the program
- The program in one school didn't affect nearby schools
12345678
# Compare schools before vs after program
import statsmodels.formula.api as smf

model = smf.ols(
  "test_scores ~ treated * post",
  data=df
).fit(cov_type="cluster")
PROGRAM IMPACT RESULTS
200 schools | 3 years pre, 3 years post
| Parameter | Estimate | Std. Error | p-value |
|---|---|---|---|
| Program effect | 8.47 | 2.31 | <0.001 |
| Time trend (all schools) | 2.34 | 1.12 | 0.039 |
Were schools trending similarly before the program?
Year-by-year differences with uncertainty bands
No significant differences before 2018 (p = 0.489)
Research assistant
Wage gap analysis
R
I need to estimate the gender wage gap in this survey, controlling for education and experience. Is OLS enough?
IQ
Loaded skill: regression-diagnostics
OLS works, but wages are skewed so I'll log-transform and check for problems your reviewers will flag:
# Log-wage model with robust SEs
model = smf.ols(
"log_wage ~ female + educ + exper",
data=df
).fit(cov_type="HC3")
# Check: is occupation a "bad control"?
# (it mediates the effect — don't include it)
Key findings:
• Gap: women earn 12.3% less (p<0.001)
• Robust SEs needed (BP test p=0.008)
• Don't control for occupation — it's a
• Gap: women earn 12.3% less (p<0.001)
• Robust SEs needed (BP test p=0.008)
• Don't control for occupation — it's a
mediator, not a confounderResiduals vs Fitted Values
Red points: potential outliers (Cook's D > 0.5)
Interactive dashboard
Women Working
25.3%
↑+0.5pp
GDP per Capita
$2,091
2015 USD
Female Enrollment
75.3%
Secondary
Fertility Rate
2.09
Urban Pop.
35.9%
Countries
8
Source: World Bank World Development Indicators
Do More Women Work as Countries Get Richer?
Each point = country, size = population
Low income
Lower-middle
Upper-middle
High income
Source: World Bank World Development Indicators
Made with Inquiro
Research questions, answered
Development Economics
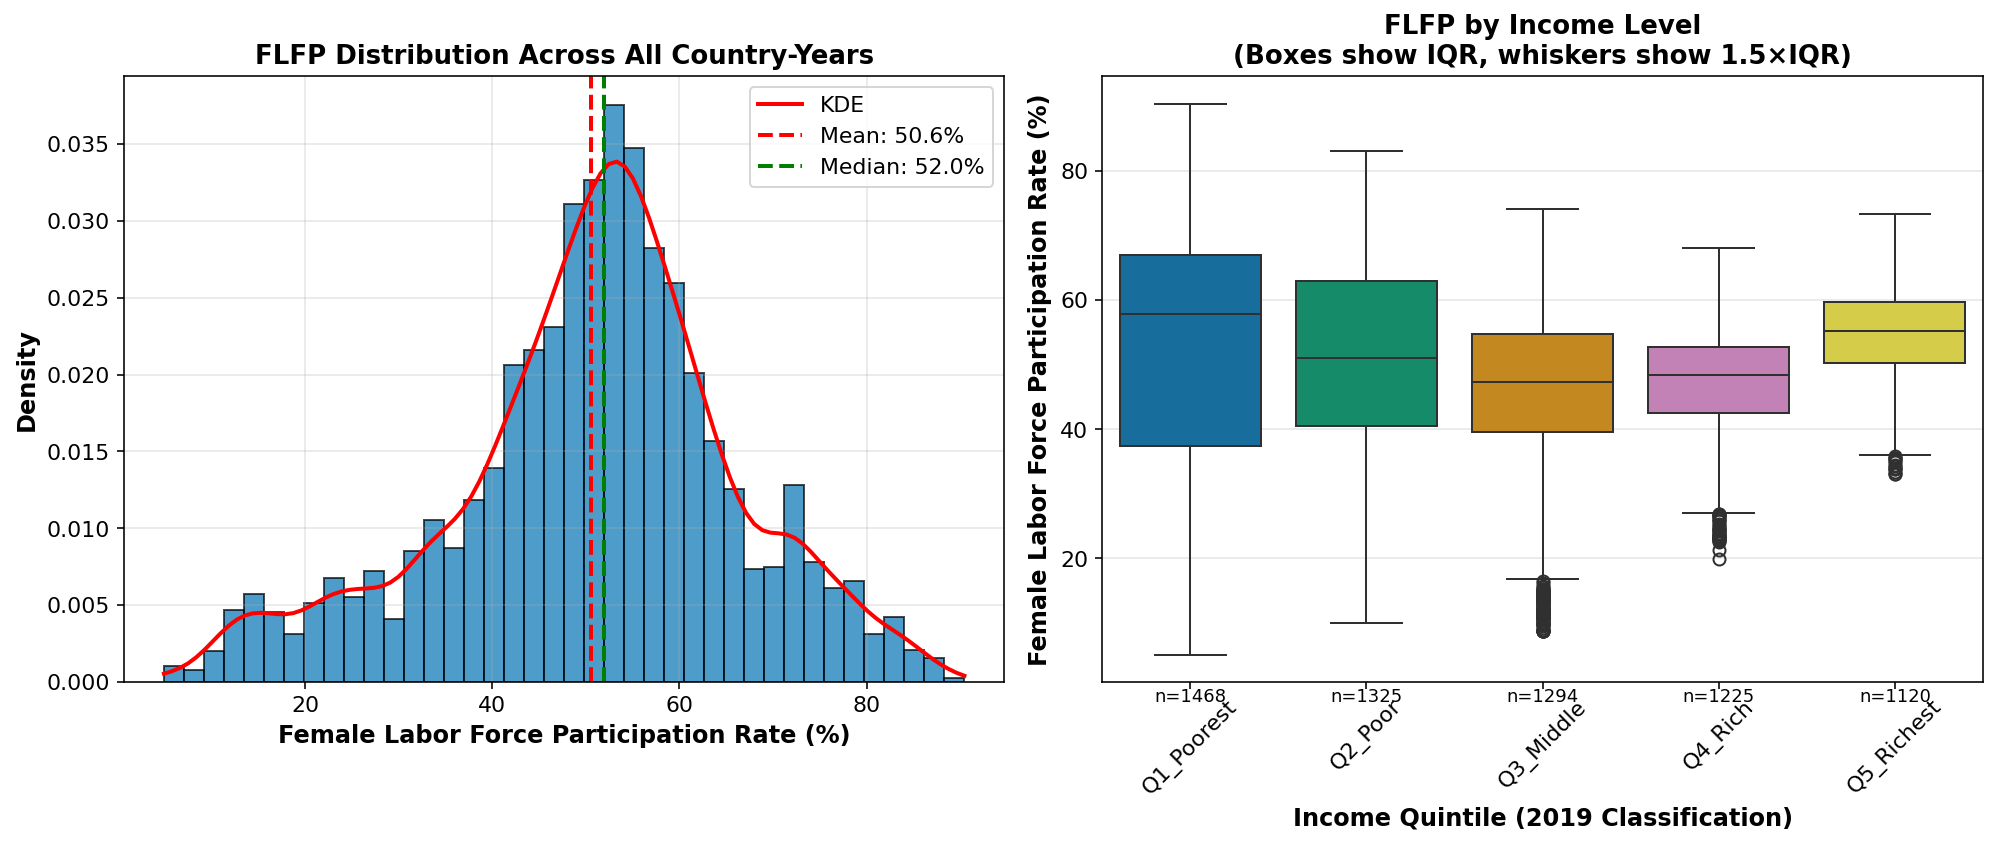
Do Women Work More as Countries Get Richer?
Panel analysis of 180 countries, 1990-2022
Infrastructure
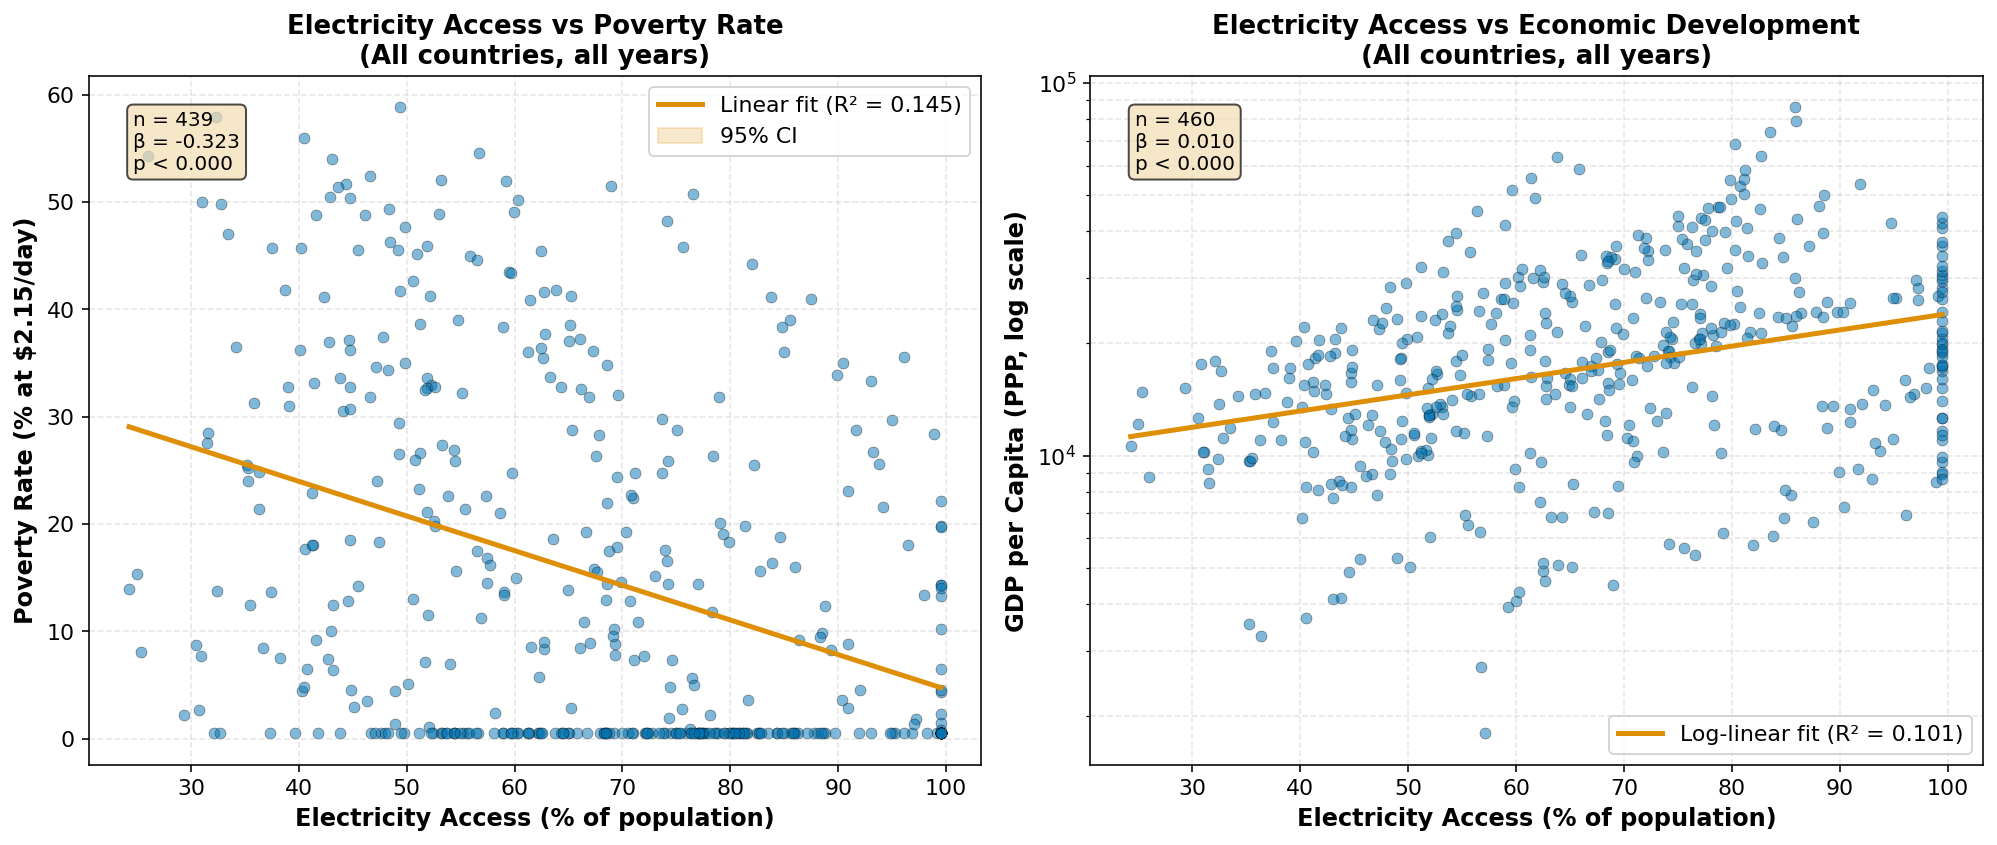
Does Electricity Reduce Poverty?
Cross-country analysis with built-in diagnostic checks
Agricultural Economics
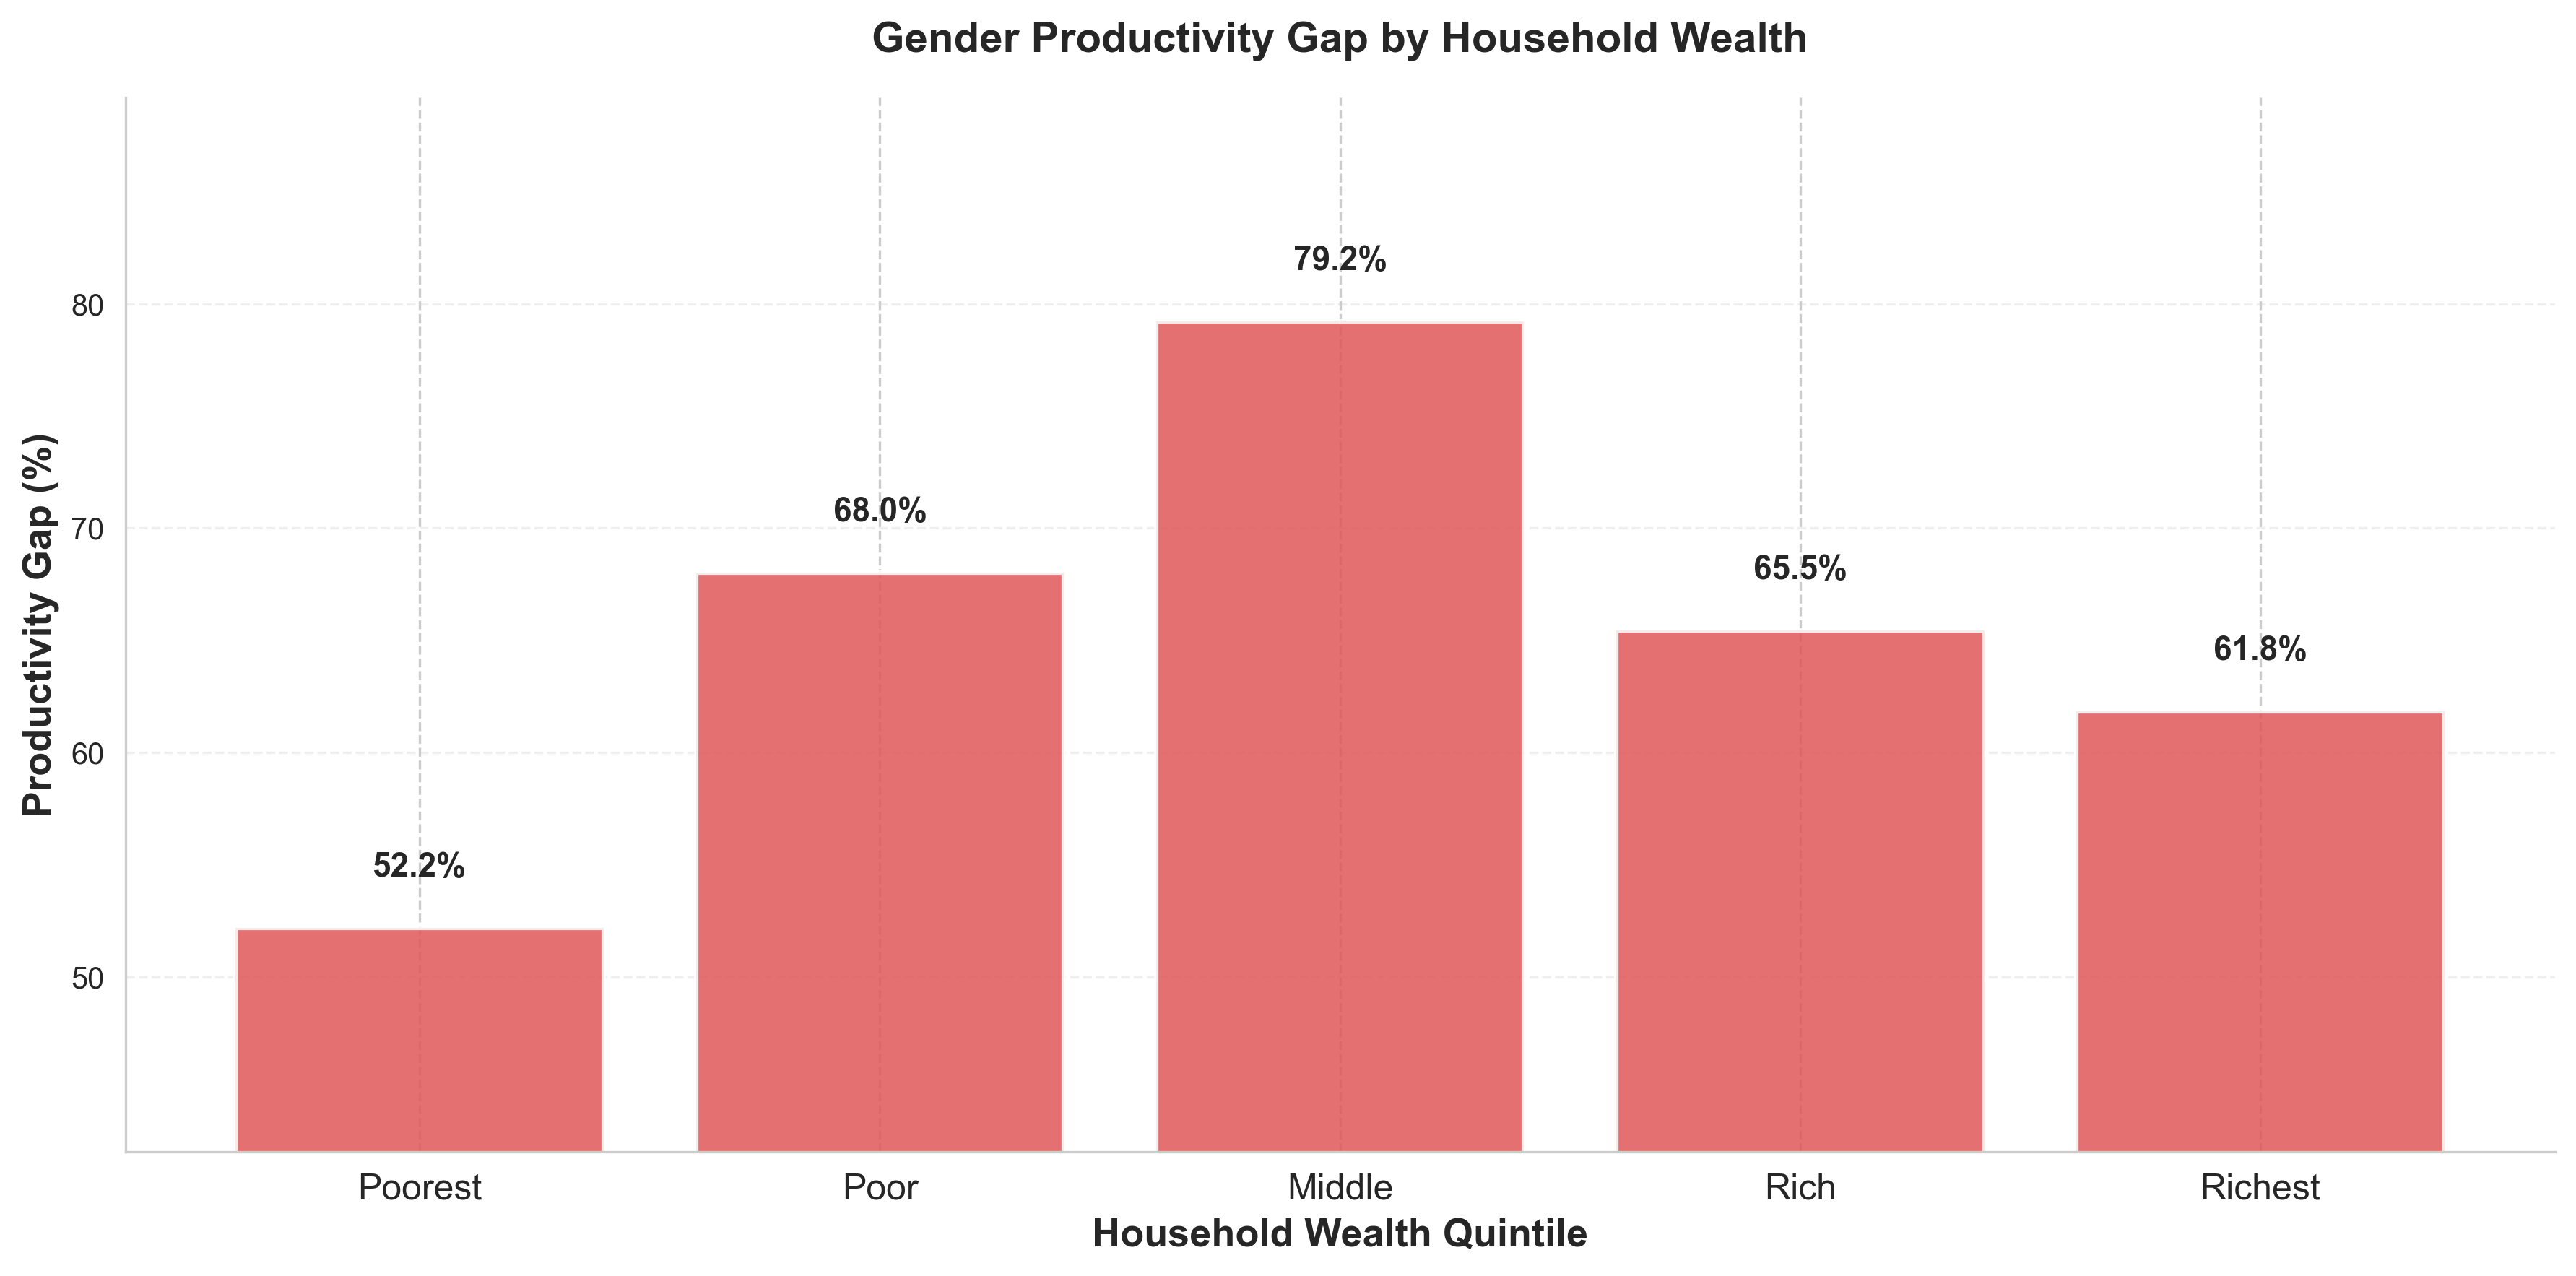
Why Do Women Farmers Produce Less?
Plot-level analysis across 6 Nigerian states
What's your
research question?
Join researchers who let Inquiro handle the methodology.